What’s this all about?
ViGraph is a new project by Paul Clark. I have a long-term interest in electronic music, laser and light art, data analysis and computing education and I wanted to create a platform which could combine all these things, while remaining accessible to non-coders.
Modules and Dataflow
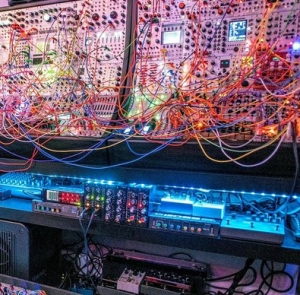
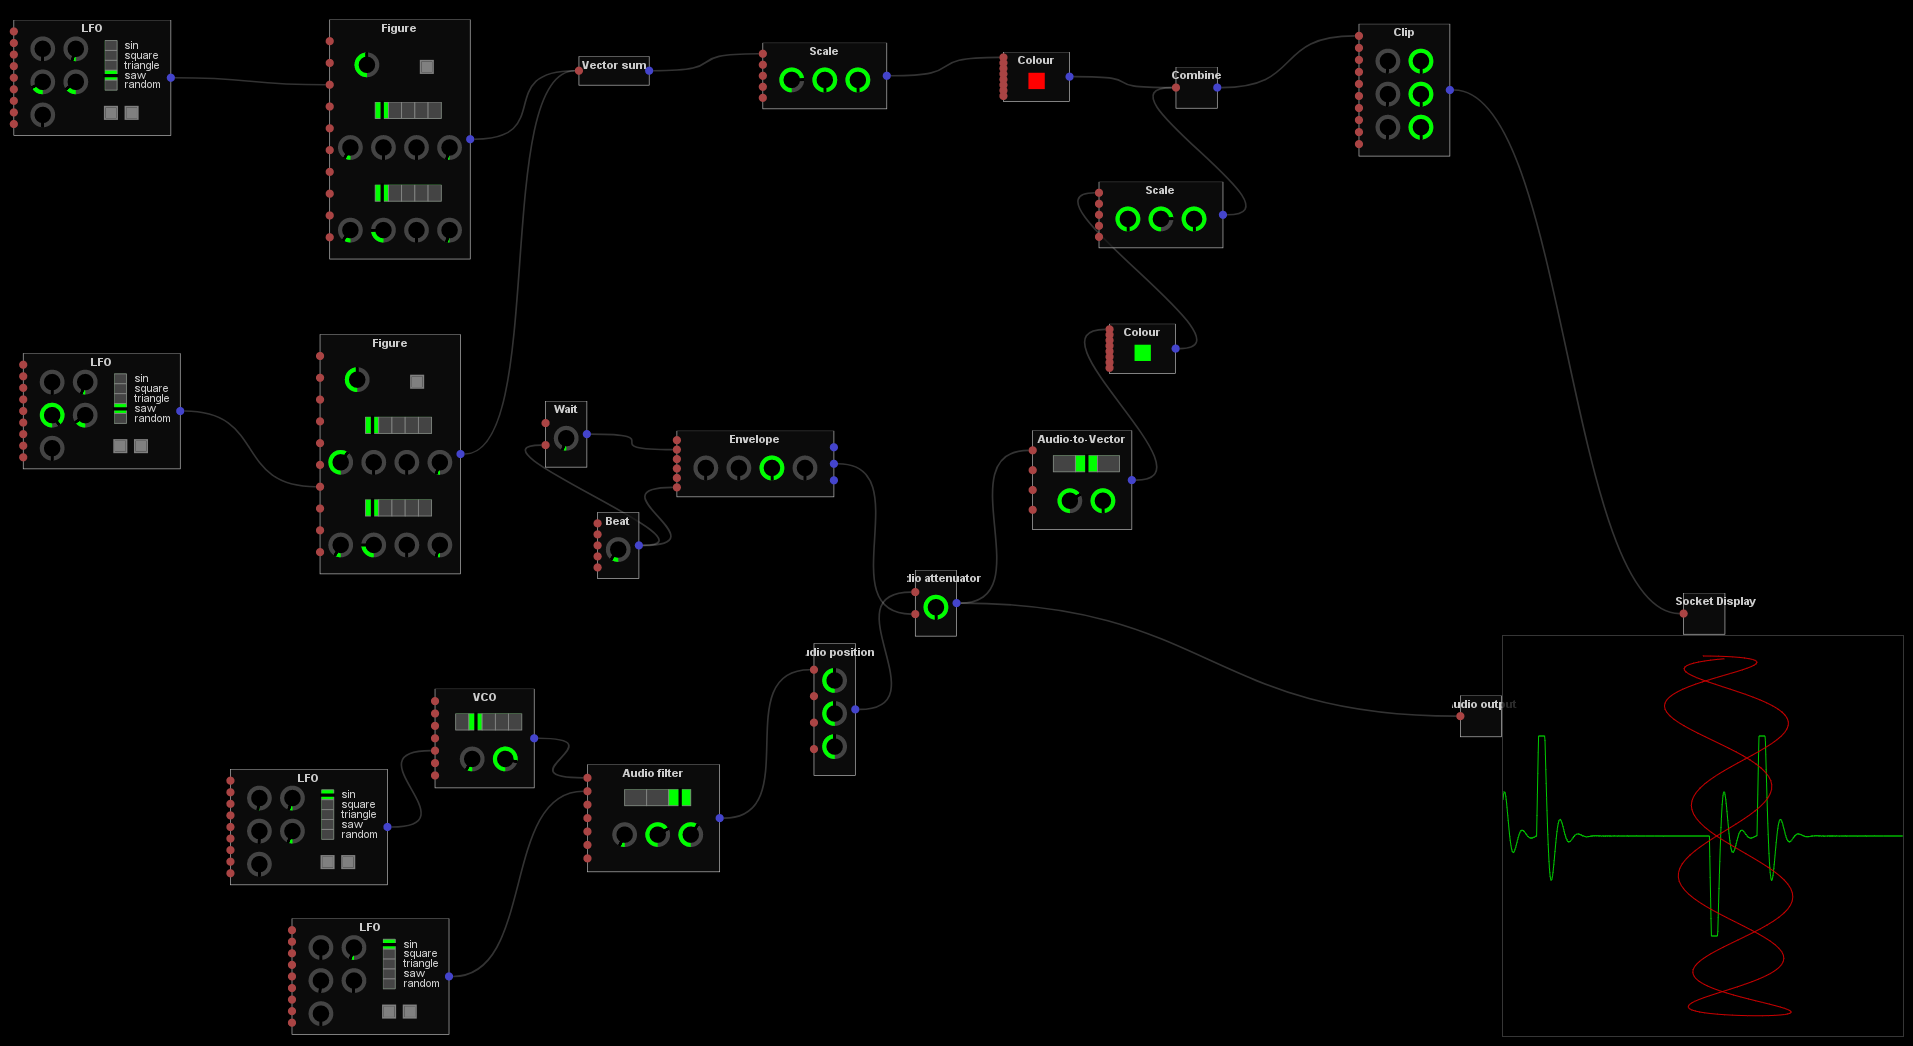
I realised looking at traditional analogue synthesisers (and their modern virtual simulations) alongside my prototype laser graphics engine and data analysis tools that they all work in essentially the same way – taking a bunch of fairly simple modules and connecting them together to create a complex system (or ‘engine’ as I like to call it, being from the land of the steam engine!).
Another word for this type of system is a “dataflow graph”, because each module takes data from its inputs, processes it somehow and passes it to its outputs, so the data ‘flows’ through the ‘graph’ (in the mathematical sense of a bunch of nodes joined by edges – although the result can be a conventional graph too!).
Everything is Data
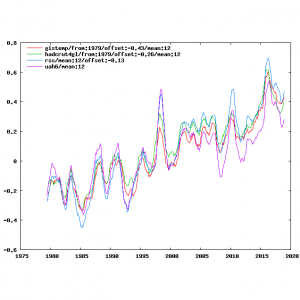
Everything ViGraph can create and manipulate is at its core a stream of data. An audio waveform is a stream of amplitudes at 44,100 samples per second. A MIDI feed is a stream of note values at maybe 10 per second max (if you can play that fast!). A laser display is a stream of frames – themselves a group of coloured points – at around 25 frames per second. Climate data might have one temperature reading per month, or (in geological time) per million years.
What’s interesting is the processes for creating, manipulating and analysing these data streams are very similar across all the different fields. What’s even more exciting is when you merge multiple data types within the same system…
Welcome to the Web
Most existing software in all the individual areas ViGraph covers are provided as software to install on your Mac or Windows or Linux PC. They are usually created as applications specific to each platform, which makes them very difficult to offer them across multiple operating systems.
The world has moved on in the last ten years – these days, many applications you use every day – Facebook, Google Docs, Slack… – are web-based, and can run on anything. I took the same approach with ViGraph. For things that need high performance like audio and laser graphics there is a background ‘engine’ application that runs on your PC but the user interface is entirely web-based. For data analysis and visualisation, it works entirely in the browser, and you don’t need to install anything.
The other benefit of splitting the user interface from the engine is that the engine can be installed wherever it is needed – in an industrial PC on a lighting gantry, next to the sound desk or even embedded in a laser or mixer itself. Then you can control it from any device, anywhere in the world. If the device you’re controlling it with runs out of battery or decides to do a System Update in the middle of a show (yes, we’ve all been there), it doesn’t matter – the engine keeps on running.


